Dashboard Pages
Each page of the Laser PI Dashboard has a direct connection to the data contained within the logbook. Clicking through run numbers from the navigation bar will update the content on each page accordingly, revealing raw data, or any data analysis that has been carried out.
Run Overview
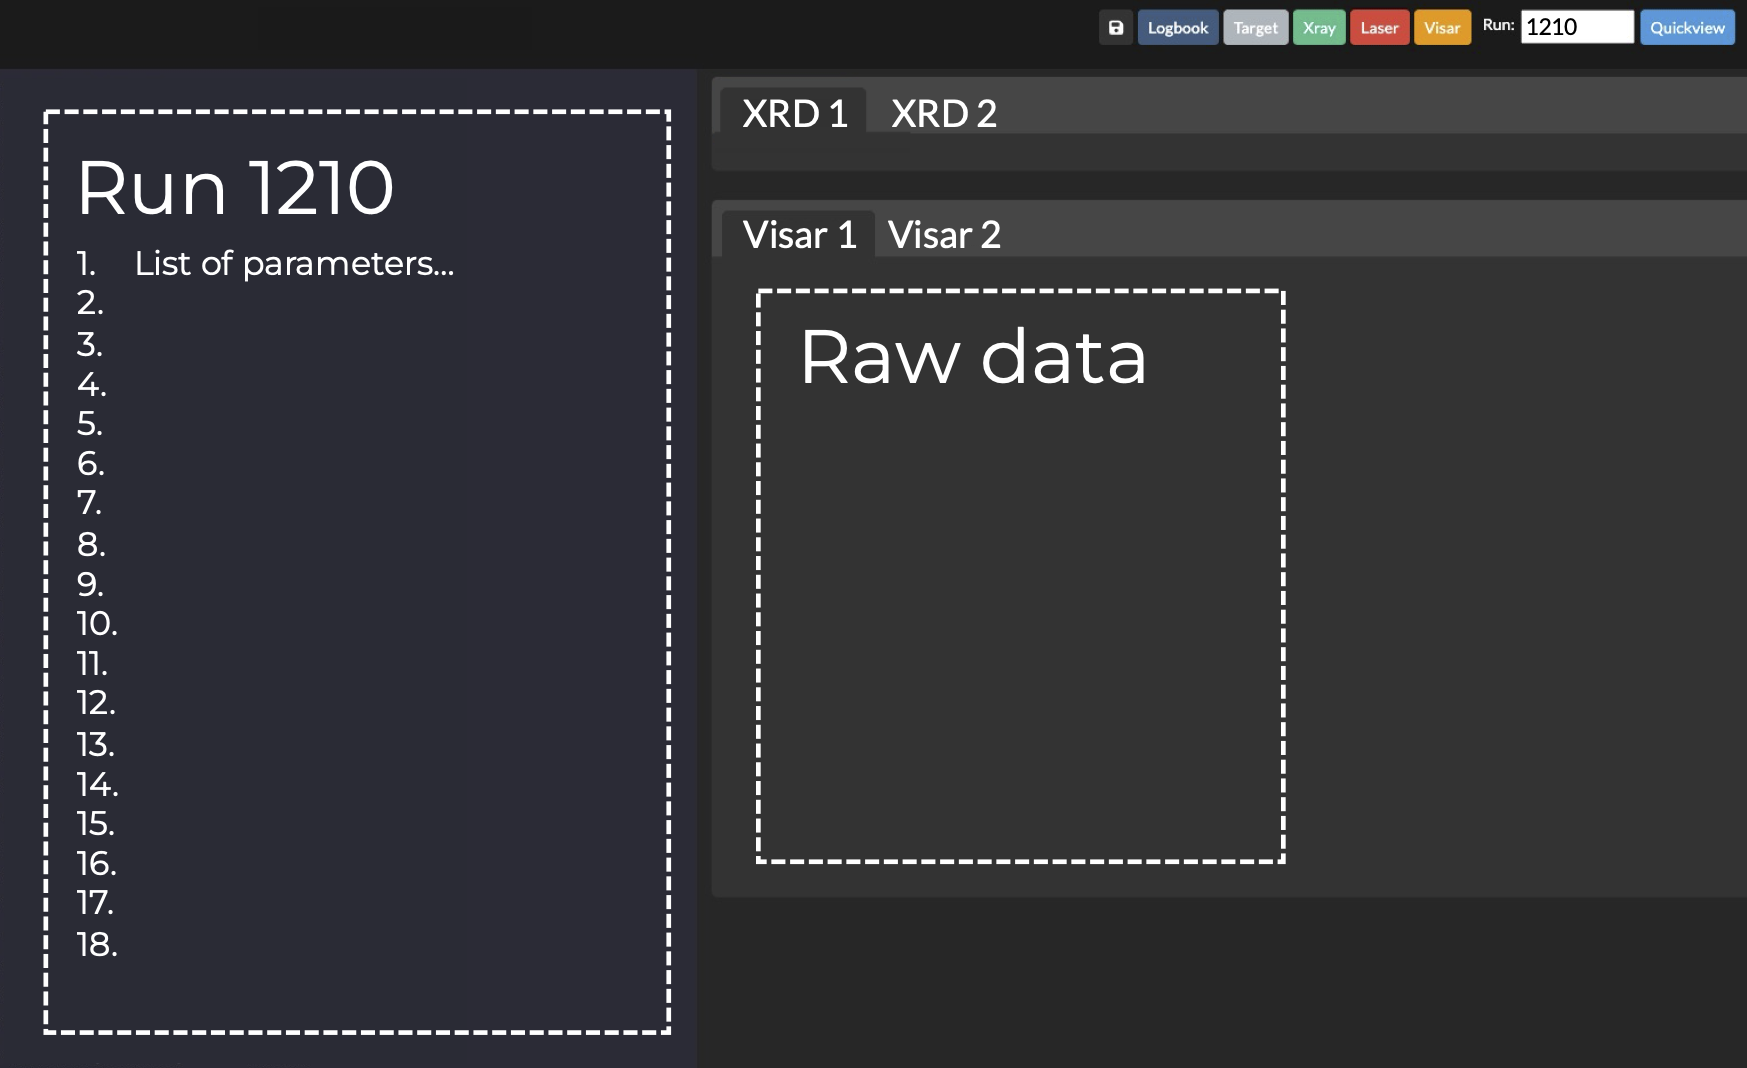
List all logbook entries for the selected run and display interactive plots of your raw data (allowing you to zoom and click on images to display key information/analysis). Images will be calibrated based on information contained within a configuration file. From the navbar you can update the run number to update the page content and display any data that exists for the selected run.

Summary Slides
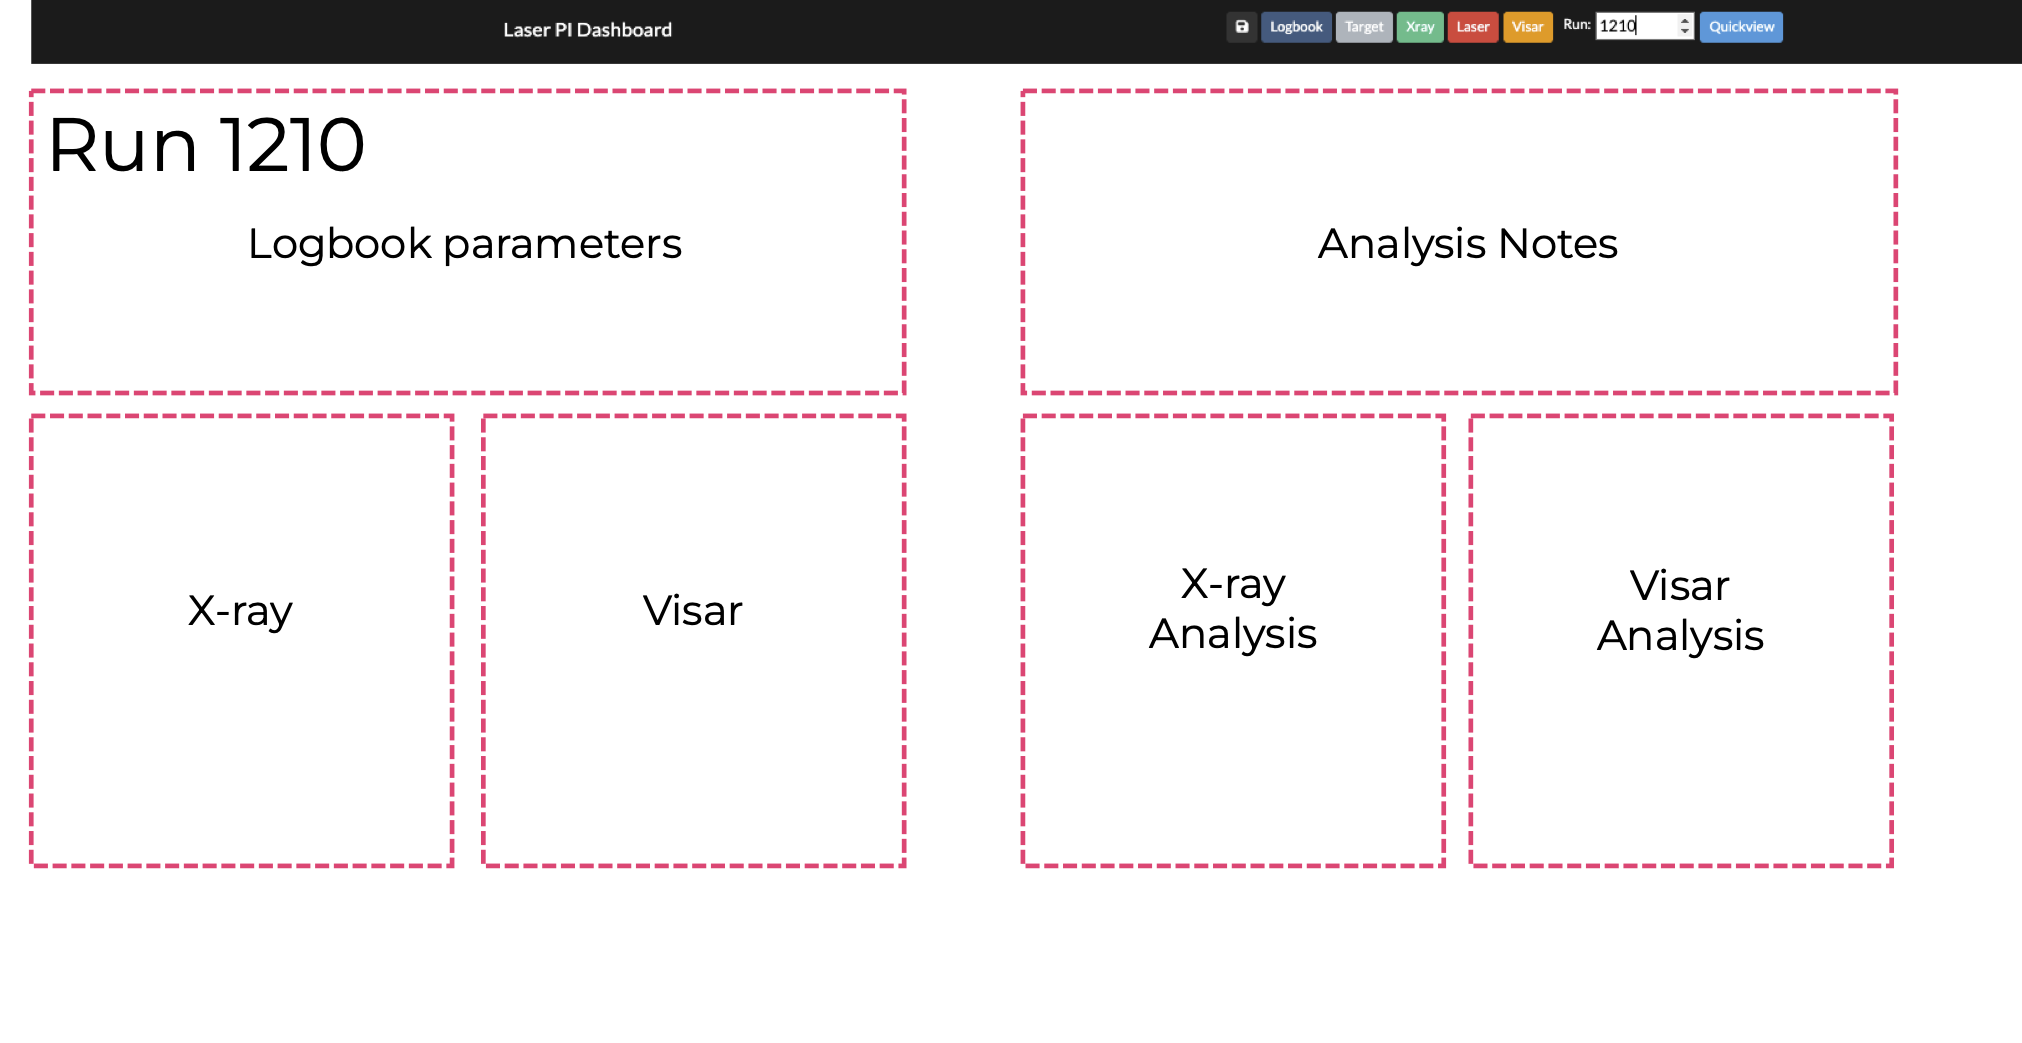
The Summary Slides page makes it incredibly easy to view a summary of the selected run. No need to search through 100's or 1000's of Powerpoint or Google Slides to find the run you are interested in. Click through from one run to another from the navbar and the Summary Slides page will update and display X-ray and Visar images, including plots of any analysis that has been carried out. Notes and analysis values from the logbook will be displayed here.

X-ray, Target, Visar, and Laser Analysis
Individual pages that are dedicated to the typical analysis that is performed on your data. Create waterfall plots for any campaign at a click of a button, hiding any particular lineout by interacting with the figure.
View a description of the target for the selected run, displaying sample-layers or material properties for all layers. List all samples and sampleID for any of the target frames you have ready to use or that have already been used
in your experiment.
Identify shock-breakout times and identify particle-velocity from your analysis that can be used to determine shock conditions in your sample.
Fit ablation-pressure values with laser ablation scaling laws, allowing you to predict what laser parameters can access the conditions you require to reach.
